Code Coverage in EK9
EK9 automatically collects code coverage data during test execution. Coverage is always enforced - if your code falls below the 80% threshold, the test runner returns exit code 12 regardless of whether tests pass.
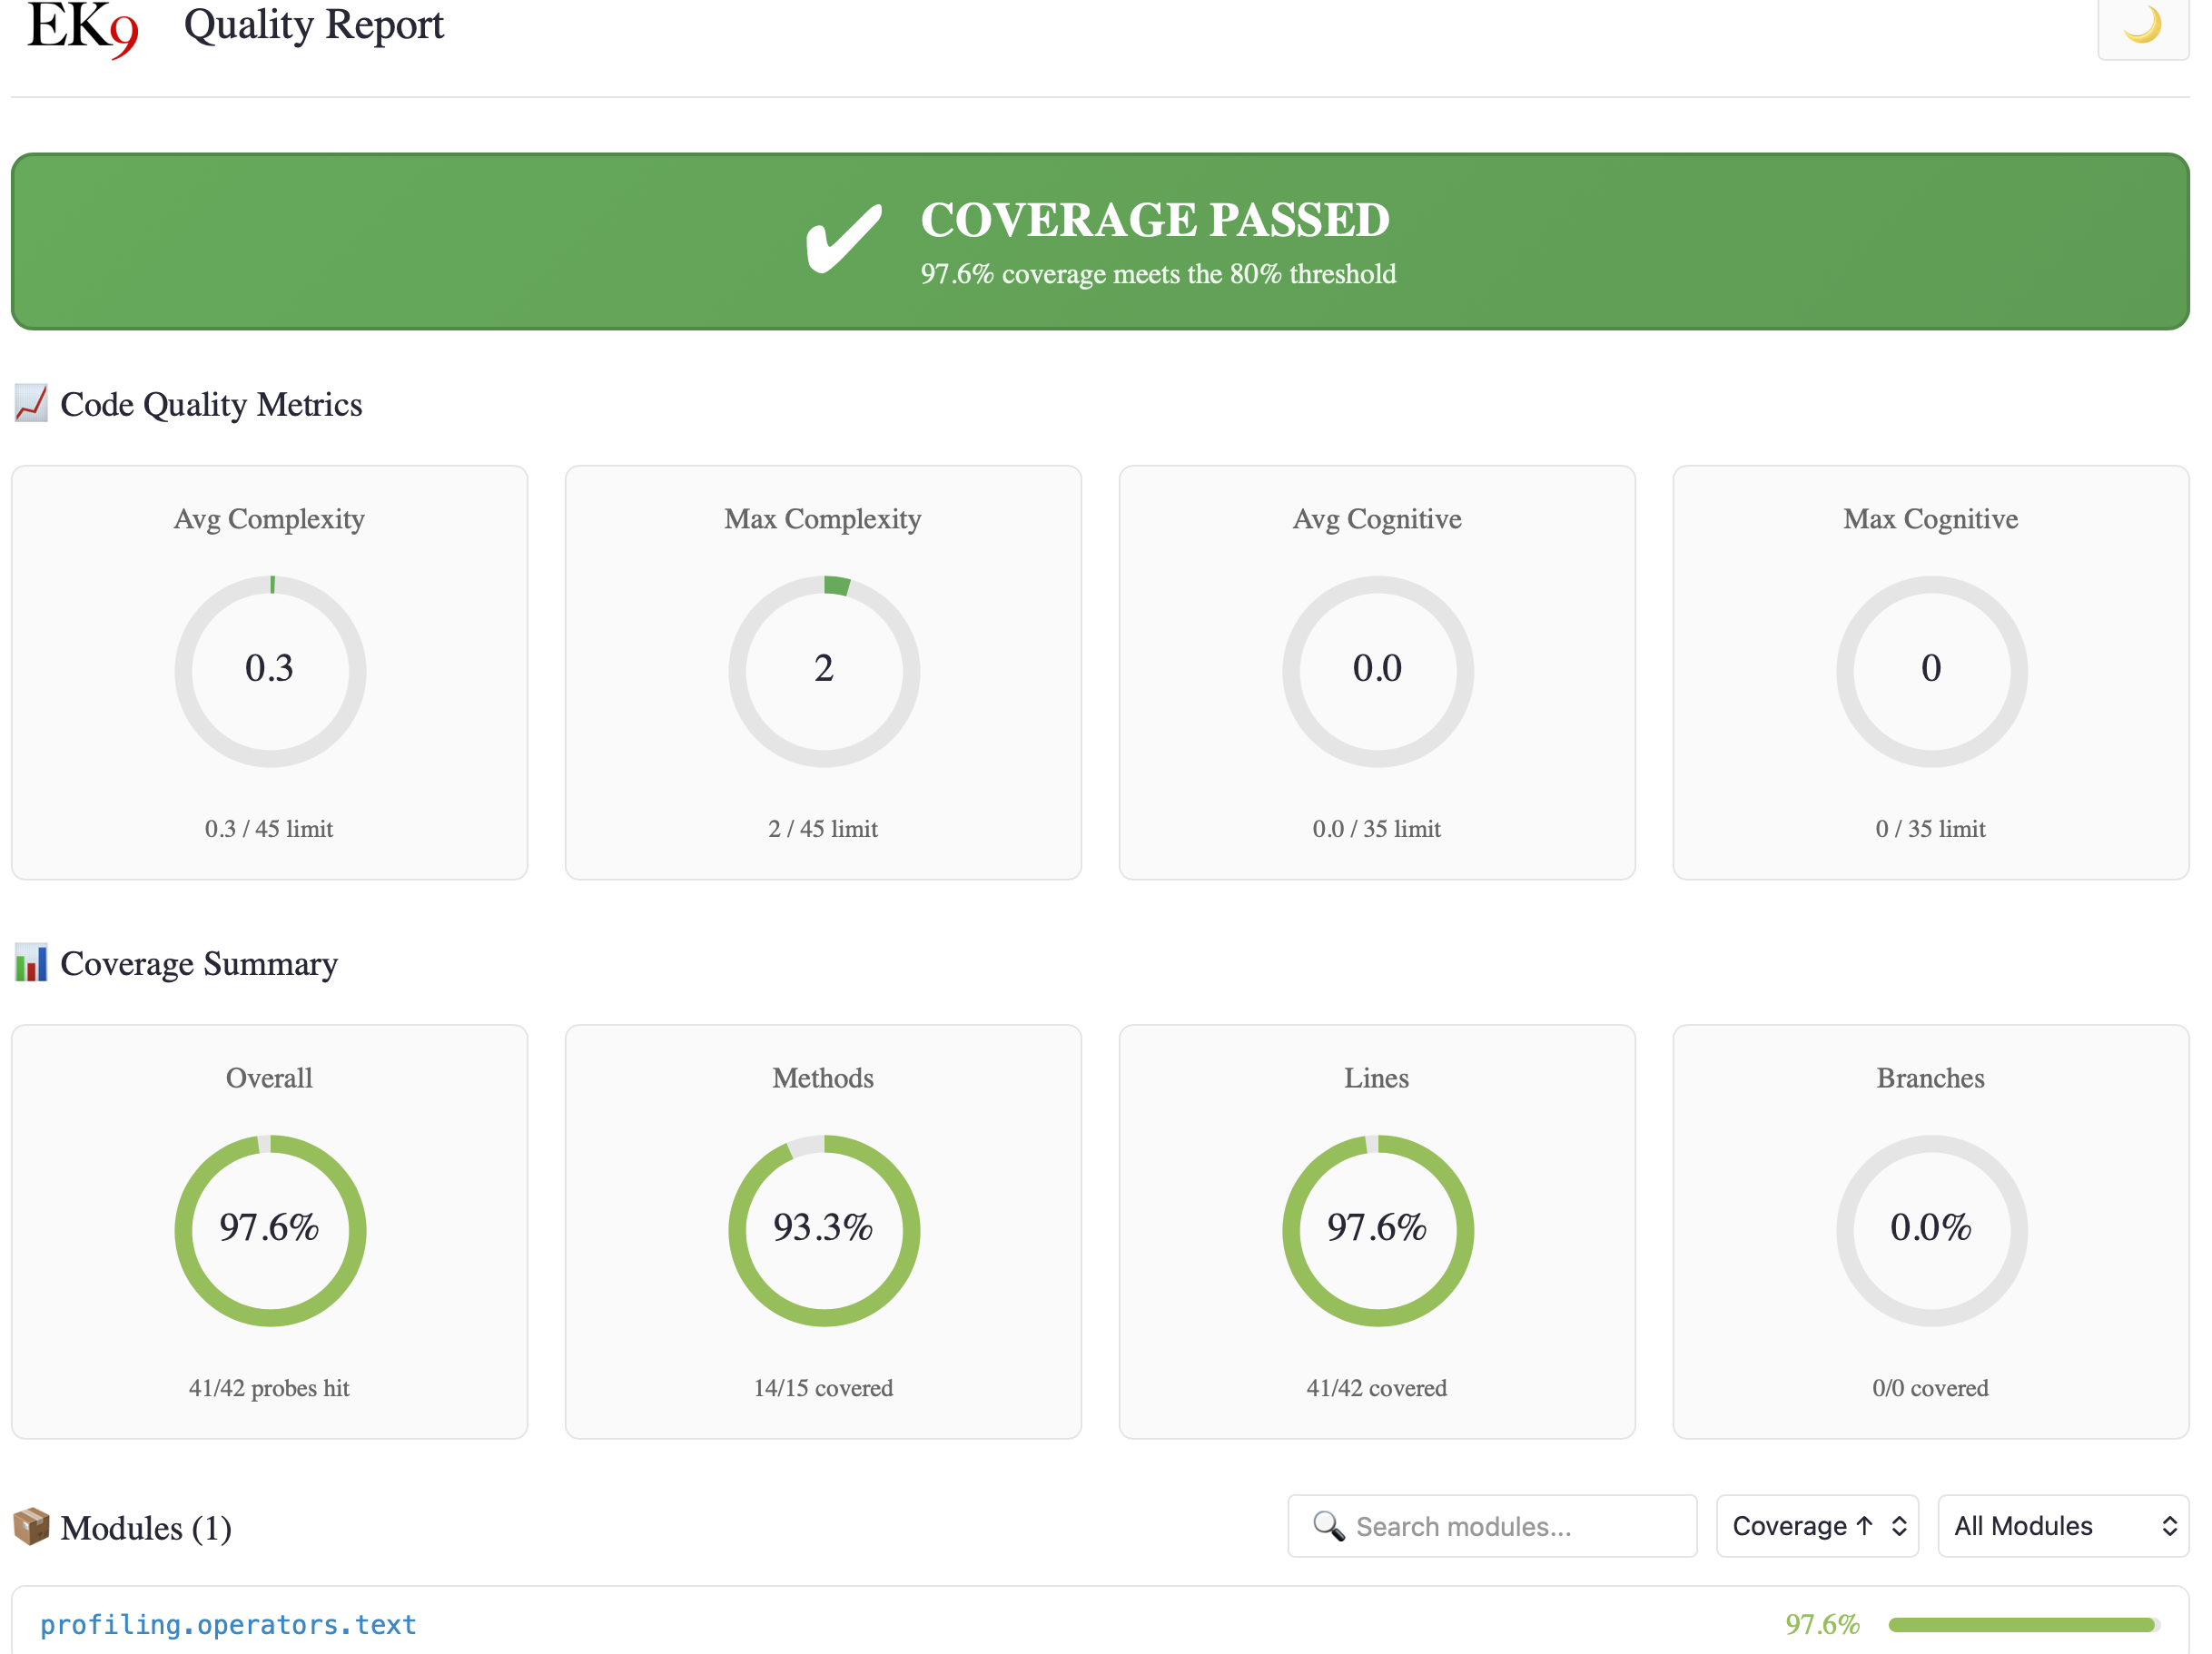
- Threshold Enforcement - Always-on 80% gate
- Coverage Output - Human, JSON, XML formats
- Verbose Coverage - Per-module breakdowns
- Quality Metrics - Complexity, cognitive load, readability
- Input Variety - What the tests actually verify, not just what ran
- Change Risk (HEX) - How costly a change here is likely to be
- HTML Reports - Interactive dashboards and source views
Threshold Enforcement
Unlike other test runners that treat coverage as optional, EK9 treats coverage as a first-class quality gate. Coverage probes are inserted at compile time at all control flow points:
- Function/method entry and exit
- Branch decisions - if/else branches, switch cases
- Loop body execution - for, for-range, while, do-while
- Exception handlers - catch/handle blocks
Coverage is always collected and enforced when running tests with -t.
If coverage falls below the 80% threshold, the test runner returns exit code 12 regardless
of whether a coverage report was requested.
$ ek9 -t main.ek9
[OK] PASS myapp.tests::AllTests [Assert] (5ms)

Summary: 1 passed, 0 failed (1 total)

❌ E83001: Code coverage 44.0% is below required threshold 80%
   Methods:  46.0% (23/50)
   Lines:    44.0% (37/84)
   Branches: 41.2% (14/34)

   Uncovered items:
     27 method(s)
     20 branch(es)

   Use -t4 or -t5 for detailed coverage report.

$ echo $?
12
This ensures CI/CD pipelines catch insufficient coverage even when developers don't explicitly request coverage reports. Tests passing is not enough - code must be tested.
Coverage Output Formats
Use -tC to display coverage results. The format follows the test output format:
ek9 -t -tC main.ek9         # Human-readable coverage summary
ek9 -t0 -tC main.ek9        # Terse coverage: Coverage: 87.5% (7/8)
ek9 -t2 -tC main.ek9        # JSON output to files
ek9 -t3 -tC main.ek9        # JUnit XML + JaCoCo XML to files
File Output for Machine Formats
When using machine formats (-t2 or -t3) with -tC,
results are written to files in the .ek9/ directory:
| Flags | Test Results | Coverage Results |
|---|---|---|
-t2 -tC |
.ek9/test-results.json |
.ek9/coverage.json |
-t3 -tC |
.ek9/test-results.xml (JUnit) |
.ek9/coverage.xml (JaCoCo) |
A human-readable summary with file paths is printed to stdout:
Summary: 3 passed, 0 failed (3 total)
Types: 3 assert
Duration: 13ms

Test results written to: .ek9/test-results.json
Coverage results written to: .ek9/coverage.json
The JaCoCo XML format (.ek9/coverage.xml) is compatible with coverage tools
like SonarQube, Codecov, and Coveralls.
Coverage JSON Format
{
  "coverage": {
    "methods": { "percentage": 100.00, "covered": 3, "total": 3 },
    "lines": { "percentage": 100.00, "covered": 5, "total": 5 },
    "branches": { "percentage": 100.00, "covered": 5, "total": 5 },
    "overall": 100.00,
    "probesHit": 5,
    "probesTotal": 5,
    "modules": {
      "my.module.tests": { "coverage": 100.00, "hit": 3, "total": 3 },
      "my.module": { "coverage": 100.00, "hit": 2, "total": 2 }
    }
  }
}
JaCoCo XML Format
<?xml version="1.0" encoding="UTF-8"?>
<!DOCTYPE report PUBLIC "-//JACOCO//DTD Report 1.1//EN" "report.dtd">
<report name="EK9 Coverage">
  <counter type="METHOD" missed="0" covered="3"/>
  <counter type="LINE" missed="0" covered="5"/>
  <counter type="BRANCH" missed="0" covered="5"/>
  <package name="my/module/tests">
    <counter type="BRANCH" missed="0" covered="3"/>
  </package>
</report>
Verbose Coverage (-t4, -t5)
For detailed analysis of what's covered and what's not:
ek9 -t4 main.ek9       # Verbose human coverage with item lists
ek9 -t5 main.ek9       # Same as -t4, plus writes coverage-verbose.json
The verbose format shows per-module breakdowns with specific items:
Coverage Report
==============

Overall Coverage: 75.0% (6/8 probes hit)

Module: myapp.core (100.0% - 4/4)
  Methods (2/2):
    [HIT] myapp.core::add
    [HIT] myapp.core::multiply
  Branches (2/2):
    [HIT] myapp.core::add:12 (IF_TRUE)
    [HIT] myapp.core::add:12 (IF_FALSE)

Module: myapp.utils (50.0% - 2/4)
  Methods (1/2):
    [HIT] myapp.utils::formatNumber
    [MISS] myapp.utils::parseNumber
  Branches (1/2):
    [HIT] myapp.utils::formatNumber:8 (IF_TRUE)
    [MISS] myapp.utils::formatNumber:8 (IF_FALSE)
With -t5, a detailed JSON file is written to .ek9/coverage-verbose.json
containing the same information in machine-readable format. See
JSON Output Schema for the complete field reference.
Code Quality Metrics
EK9's coverage system goes beyond simple line and branch counting. Every function is analyzed for code quality metrics that help identify complex, hard-to-maintain code.
For AI Assistants: See Metrics Reference for complete threshold tables, recommended actions, and workflow templates for iterative quality improvement.
Available Metrics
| Metric | Range | Description |
|---|---|---|
| Cyclomatic Complexity (CC) | 1-50+ | Number of linearly independent paths through code. Each if,
switch case, for, while, and exception handler
adds 1. Target: <10 per function. |
| Cognitive Complexity | 0-50+ | Mental effort required to understand code. Penalizes nesting, breaks in linear flow, and boolean complexity. Better reflects human comprehension than CC. Target: <15. |
| Nesting Depth | 0-10+ | Maximum depth of nested control structures. Deep nesting indicates code that should be refactored. Target: <4. |
| Statement Count | 0-100+ | Number of executable statements. Large functions are harder to test and maintain. Target: <20 per function. |
| ARI Readability | 1-12+ | Automated Readability Index measuring lexical complexity (identifier length and statement density). Lower = simpler to read. File-level metric. |
Compile-Time Enforcement: Many of these metrics are enforced at compile-time with hard limits for BOTH production and test code. See Code Quality for complete documentation of thresholds, error codes, and the rationale behind each limit.
Where Metrics Appear
Quality metrics are integrated throughout the coverage reports:
- Dashboard - Project-wide averages and maximums in the Code Quality Metrics panel
- Module pages - Per-module metrics summary with avg/max complexity
- Source views - Complexity badges on each function definition showing CC, Cognitive, and Nesting
- Attention panel - Flags functions with high complexity that need refactoring
Complexity Badges in Source Views
Each function in source views displays a complexity badge:
isNumeric()                                      CC:6
  -> text as String
  <- result as Boolean: false
  ...
Badge colors indicate severity:
- Green - CC ≤ 10: Good, maintainable complexity
- Orange - CC 11-20: Consider refactoring
- Red - CC > 20: High complexity, should refactor
Hover over badges to see full metrics: CC:6 Cog:1 Nest:1
Readability (ARI) Scores
The Automated Readability Index measures lexical complexity - how easy it is to read the words in your code (not understand the logic). Lower scores indicate simpler identifier names and statement structure.
ARI is shown per-file on module detail pages:
📖 Lexical Complexity
   formatters.ek9      6
   stringHelpers.ek9   6
   validators.ek9      3
Score interpretation:
- 1-6: Simple, clear identifiers
- 7-10: Moderate complexity
- 11+: Dense, consider simplifying names
Note: ARI is an informational metric with no compile-time enforcement. Domain-specific terminology often requires longer identifiers. See ARI Readability for complete documentation and domain considerations.
Input Variety
Coverage answers one question: did this line run? It cannot tell you whether the line ran with input that mattered, or whether anything checked the result. A project can sit at 100% coverage while no test asserts anything at all — and coverage will report that as a perfect score.
Input variety measures the other two questions. For every construct the compiler works out a floor: the value-classes its parameters can meaningfully take. Then the test run records which of those were actually reached, and which had their result checked.
- Coverage - the code ran. The outermost and weakest claim.
- Driven - the code ran with a meaningfully different input.
- Asserted - something checked the result. The only figure that verifies anything.
The floor is 1-wise: each value-class needs to be driven at least once, not every
combination of them. A function taking a three-member enumeration and a
Boolean has a floor of seven (4 + 3), not twelve — so saturating variety is
achievable rather than combinatorially hopeless.
Value-classes and why the parameter type matters
How well a construct can be measured depends entirely on what its parameter types say. An
enumeration declares its own value-classes: its members, plus
unset. Boolean has exactly three — true, false, unset. These are known
exactly.
A String is different: its meaningful values have to be guessed at, because the
type does not say what they are. Constructs taking one are reported separately as
approximate rather than folded in with measured ones — and that is a work list,
not an apology. Replacing a bare String parameter with an enumeration or a
constrained type moves the construct into the measured group
and makes the type carry the meaning, which is what EK9 asks for everywhere else.
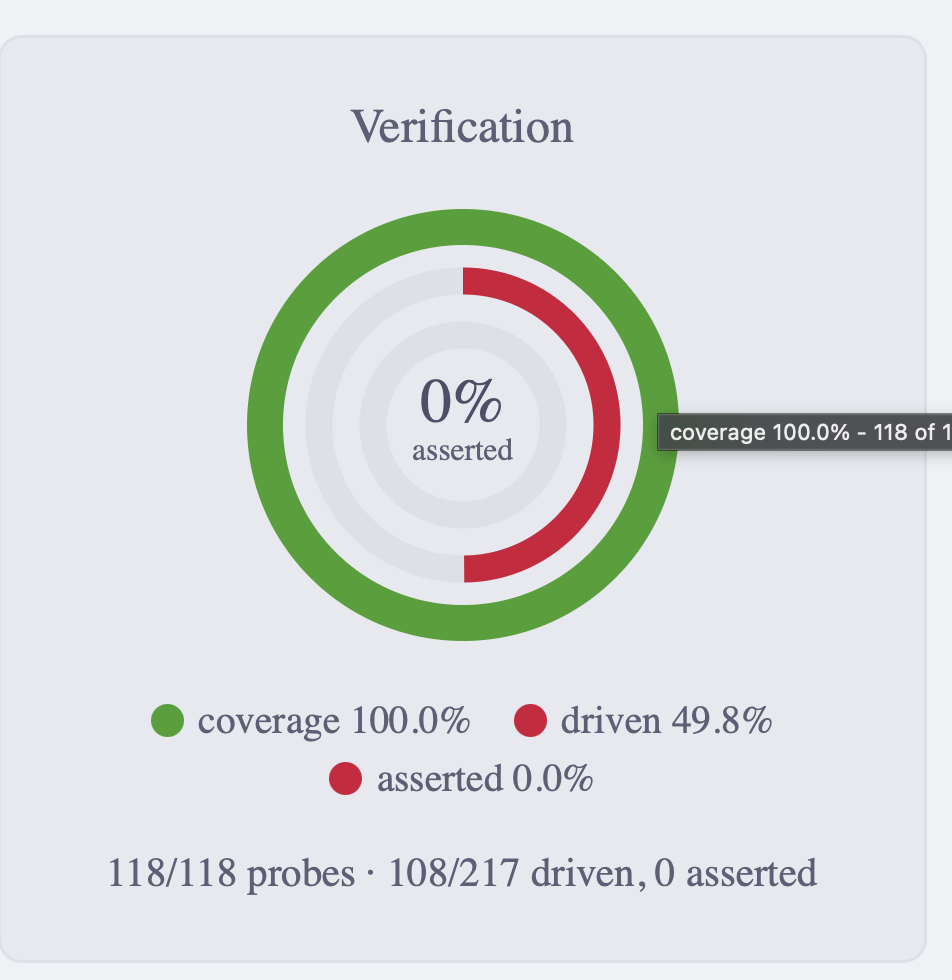
The three rings on a project at 100% coverage that asserts nothing: the outer ring complete, the middle ring half-filled, and the centre empty. Every ring answers for itself on hover, so the counts behind a segment are readable without leaving the chart.
A wide gap between driven and asserted is the signal to look for: it means code is being exercised as scaffolding for other tests, with nothing verifying what it did.
Change Risk (HEX)
HEX fuses the metrics above into one question: how costly is a change here likely to be? It is the product of two factors:
- Hazard - how much a change can break, from complexity and coupling.
- Exposure - how little the tests would notice, from coverage and asserted variety.
Both matter, and neither is sufficient alone. Complex code that is thoroughly verified is not especially risky to change; trivial code that nothing checks is not especially risky either. Risk is where the two meet.
HEX never gates a build. Coverage is the enforced threshold; HEX is an indicator, for a human or an AI deciding where to be careful. It exists to counter the idea that a coverage percentage on its own says whether code is safe to change.
Reading the score
A score of 0–100 with bands at 25 and 50 (low / moderate / high). Read the typical score and the worst single construct together: a calm average over a dangerous outlier means the area is fine but that one construct will bite, and the average will reassure you about it wrongly. A worst case close to the average means the weakness is systemic, and fixing one construct will not move it.
A low score means low change-risk, not "well tested". A trivial construct scores
low because there is little to go wrong, not because it is guarded. This is why the report shows
the two factors separately on every construct: hazard 0% × exposure 100%
and hazard 20% × exposure 0% both fuse to a score of zero, and they are
opposite situations. The first is untested trivial code; the second is genuinely guarded code.
How much of your project could be measured
Constructs are reported in three groups, because a score over a known input space and a score over a guessed one are different measurements and averaging them produces a number that means neither:
- Measured - the input space is known exactly. These are what the headline describes.
- Approximate - the input space had to be inferred. Tighten the parameter types to move these into the measured group.
- Coverage-only - there was nothing to vary (no parameters, or a compiler-generated body), so exposure comes from coverage alone. Nothing to fix here.
HTML Coverage Reports (-t6)
Generate comprehensive interactive HTML reports:
ek9 -t6 main.ek9       # Generate HTML coverage report
ek9 -t6p main.ek9      # HTML report with profiling (flame graph, hot function table)
This creates a full coverage website in .ek9/coverage/ with multiple
interconnected views.
Report Structure
.ek9/coverage/
├── index.html              # Dashboard with project overview
├── modules/                # Module detail pages
│   ├── myapp_core.html
│   └── myapp_utils.html
├── files/                  # Source file views
│   ├── __core_ek9.html     # Full source with highlighting
│   └── summary/            # File summary views
│       └── __core_ek9.html
├── coverage.css            # Styles with dark mode support
├── coverage.js             # Interactive features
├── EK9.png                 # Branding
└── ek9favicon.png
Dashboard (index.html)
Every page — project, module and file — opens with the same band, so the reading is the same wherever you have drilled to: what the tests verify, and what that means for changing this code.
Quality at a Glance
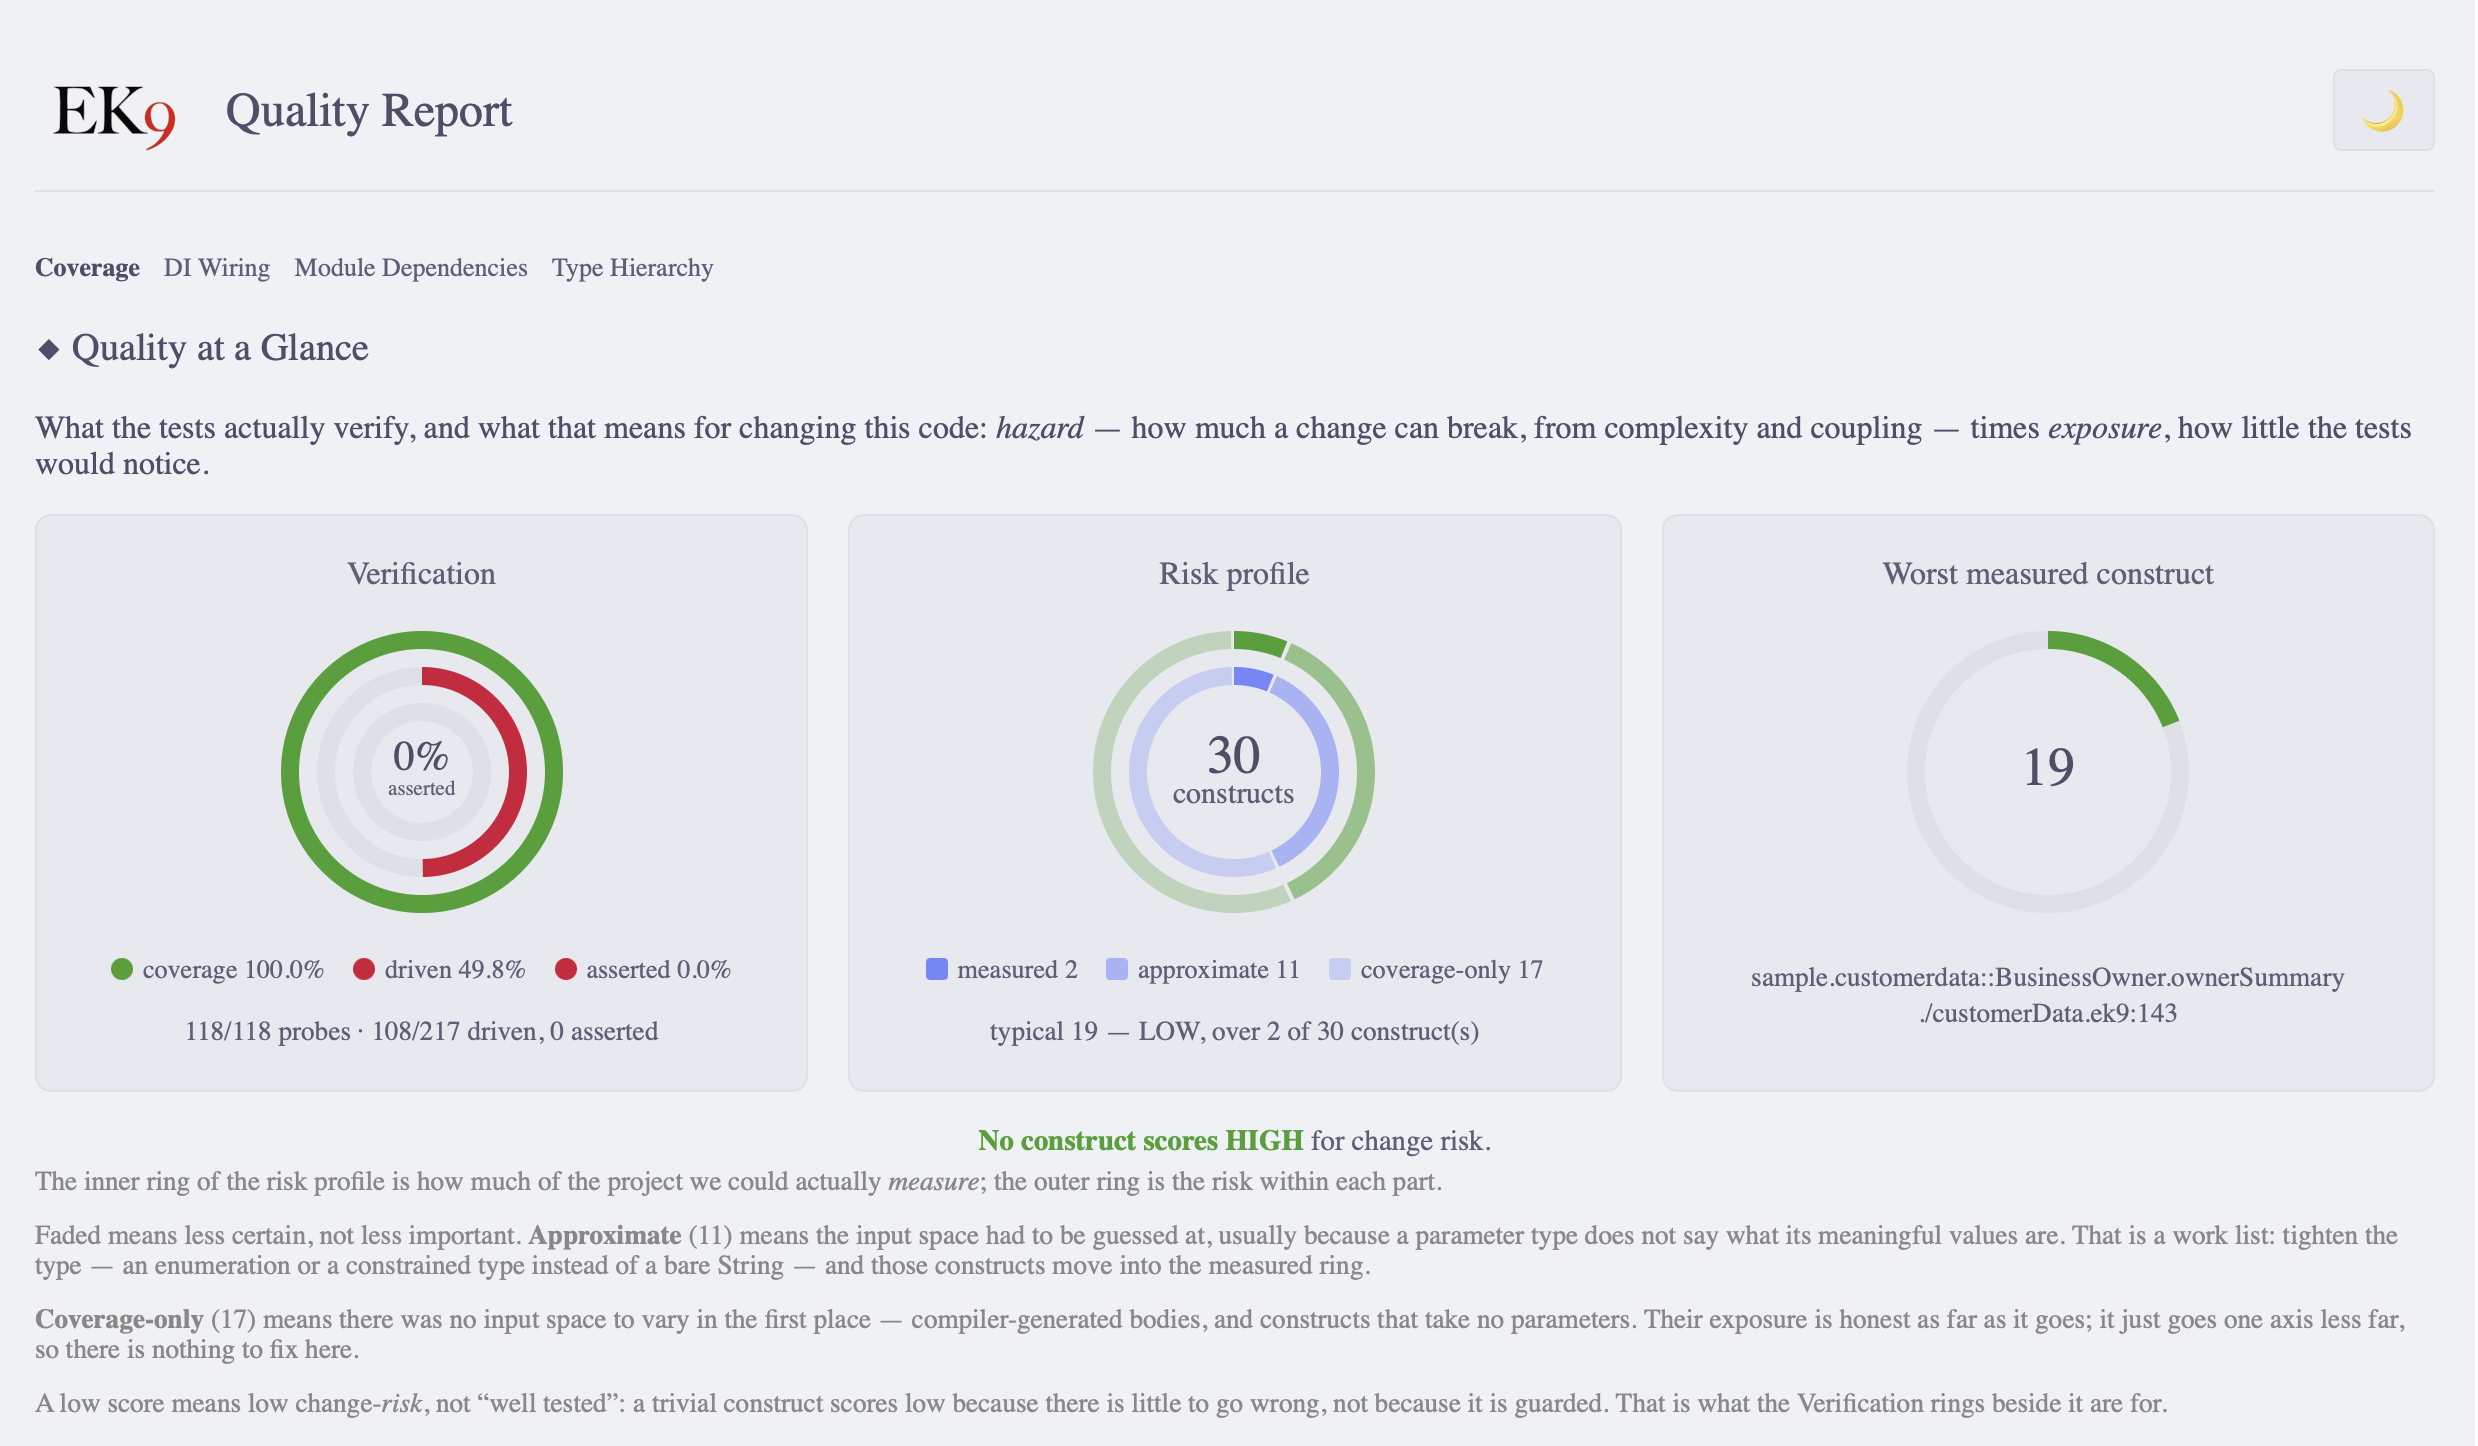
- Verification - a target of three concentric rings: coverage on the outside, then driven, then asserted at the centre. Each is a narrower claim about the same code, so the gap between the outer ring and the centre is the finding. A full outer ring around an empty centre is a project at 100% coverage that asserts nothing.
- Risk profile - the HEX sunburst. The inner ring is how much of the project could actually be measured; the outer ring is the risk within each part. Faded means less certain, not less important. Hover any segment for its counts.
- Worst construct - named, with its file and line, so the panel points somewhere.
- Scoring HIGH - a literal count, because three high-risk constructs among two hundred is an arc too small to see and is the single thing worth telling you.
The rings and the bars point in opposite directions on purpose. A ring is a target to fill — full is good. A budget bar is a ceiling to stay under — empty is good.
The rest of the dashboard
- Package Info - Project metadata from package.ek9 (version, license, tags)
- Code Quality Metrics - complexity and cognitive complexity as budget tracks (below)
- Input Variety - the floor, driven and asserted figures with their explanation
- Coverage Detail - Methods, Lines and Branches (the overall figure is the target's outer ring, so it is not repeated here)
- Attention Panel - Card-based view of modules below threshold with:
- Severity indicator (🔴 critical <50%, 🟠 warning 50-79%)
- Coverage bar showing progress
- Probe counts and uncovered function counts
- Module List - Sortable, filterable, searchable module breakdown
Complexity budget tracks

One track per metric, with the maximum as the bar and the average as a marker on the same track — because their relationship is the finding. A wide gap means one outlier is dragging the maximum while the rest of the code is calm, so there is a single construct to go and fix. An average close to the maximum means it is systemic, and fixing one construct will not move it. The remaining headroom is stated in words beside each track.
These limits are enforced: pass them and the code does not compile (E11010
complexity, E11021 cognitive complexity). Readability is shown alongside as a
reported value with no bar, because no error fires on it — it is measured and stated, never
enforced.
Module and File Pages
Click any module to see the same band scoped to it, then the detail:
- Quality at a Glance - the module's own verification target and risk profile
- Code Quality Metrics - the module's complexity budget tracks
- Coverage Detail - Methods, Lines, Branches with mini charts
- Source Files - Coverage bars for each file in the module
- Functions & Methods - every construct with its coverage status, its input-variety marker, and its own change-risk cell showing score, hazard and exposure
A file page carries the same rows. It states its HIGH count rather than repeating the charts: over a handful of constructs a chart restates what the rows already say, and each row is already carrying that construct's score and both its factors.
Source Code Views
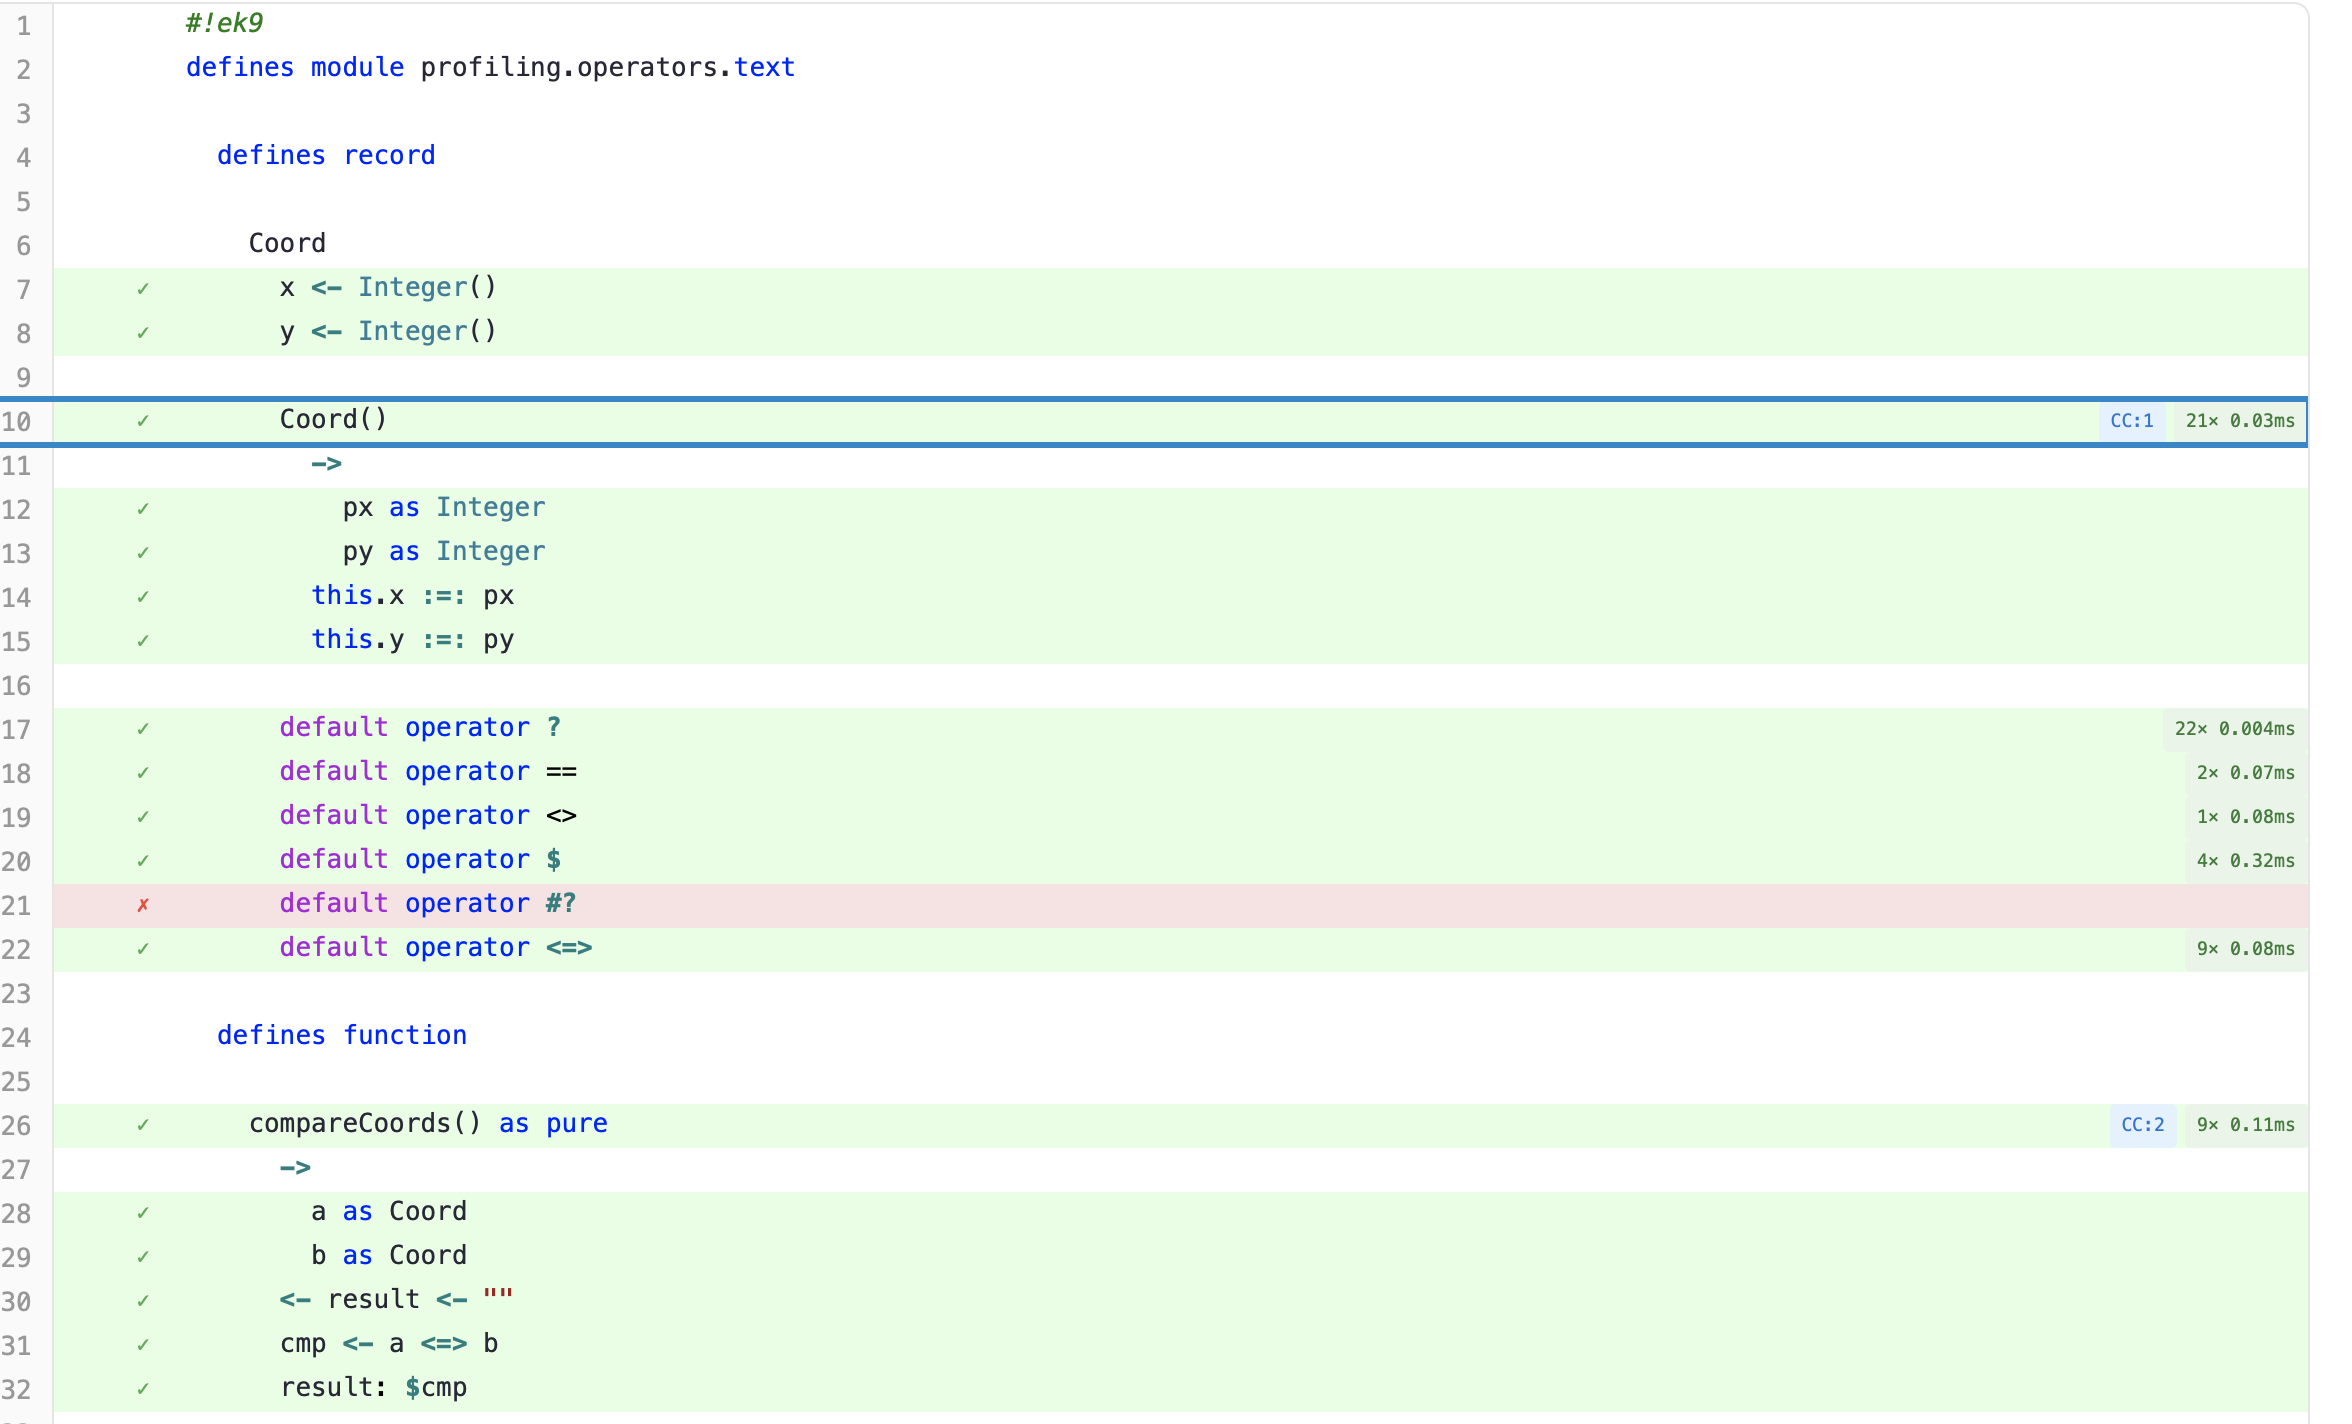
The most detailed view shows syntax-highlighted source with coverage data overlaid:
- Line Highlighting - Green background for covered lines, red for uncovered, gray for lines without coverage probes (declarations, comments).
- Hit Count Column - Shows a checkmark for covered lines and an X for uncovered lines, giving a quick visual scan of coverage gaps.
- Complexity Badges - Each function/method shows a colored badge with cyclomatic complexity (CC), cognitive complexity (Cog), and nesting depth (Nest). Badge colors: green (CC ≤ 10), orange (CC 11-20), red (CC > 20).
- Input Variety Marker - A triangle on each construct's declaration line, coloured by how much of that construct's input floor the tests drove. Hover it for the value-classes driven and how many were asserted on.
- Change Risk Badge -
HandEon each construct's declaration line: hazard and exposure, deliberately shown as the two factors rather than the fused score. This is the only place you are looking at the actual code, so the two figures name which of the two available fixes applies to the lines underneath — make the code less dangerous, or make the tests notice more.H0 E100is trivial code nothing checks;H40 E0is demanding code that is fully guarded. Both score zero. - Profiling Badges - When profiling is enabled
(
-t6p), each function shows call count and average execution time (e.g.,21× 0.03ms) alongside the complexity badge. Hover for full performance profile: total, self, min, max, and percentiles (p50, p95, p99). - Branch Indicators - BRANCH_TRUE, BRANCH_FALSE, and LOOP_BODY badges show which control flow paths were taken during testing.
- Filter Buttons - Toggle between showing all lines, only covered lines, or only uncovered lines to focus attention.
Interactive Features
- Dark/Light Mode - Toggle with moon/sun icon, persists across sessions
- Module Search - Type to filter modules by name
- Module Sort - By coverage (ascending/descending) or name
- Module Filter - Show all, failing only (<80%), or passing only
- Line Anchors - Direct links to specific lines (#L42)
Navigation Flow
Dashboard (index.html)
    │
    ├─╺ Attention Panel ╺ Module Page
    │
    └─╺ Module List ╺ Module Page (modules/myapp_utils.html)
                          │
                          ├─╺ Source File List ╺ File Summary
                          │                         │
                          │                         └─╺ Source View (files/__utils_ek9.html)
                          │
                          └─╺ Function List ╺ Source View (with line anchor)
Breadcrumb navigation allows moving back up: Source → Module → Dashboard
See Also
- Testing - Test types, assertions, test runner commands
- Profiling - Performance analysis, flame graphs, hot function table
- Test Generation - Mutation testing for assessing test quality
- Code Quality - Quality enforcement rules and thresholds
- Command Line - All flags and exit codes
- For AI Assistants - Machine-readable output schemas